
Page 73 - Customize-Project-Plan-by-tailoring-Smartsheet
P. 73
Customize your Project Plan
by tailoring Smartsheet
CASE STUDY
In the previous chapter we saw how we can use conditional formatting to visualize the slack time.
Another possibility to display the slack time visually is to work with symbols.
The most popular, is probably the so-called "traffic light assignment"
( red, yellow, green). We want to put this now into practice here.
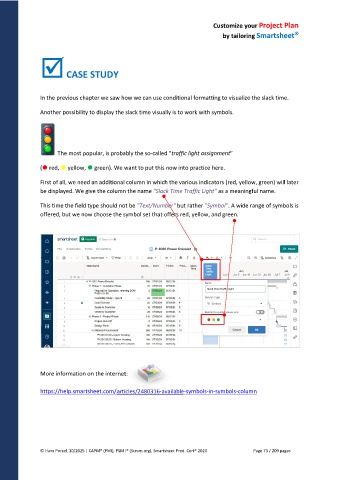
First of all, we need an additional column in which the various indicators (red, yellow, green) will later
be displayed. We give the column the name "Slack Time Traffic Light" as a meaningful name.
This time the field type should not be "Text/Number" but rather "Symbol". A wide range of symbols is
offered, but we now choose the symbol set that offers red, yellow, and green.
More information on the internet:
https://help.smartsheet.com/articles/2480316-available-symbols-in-symbols-column
© Hans Porzel, 10/2025 | CAPM® (PMI), PSM I® (Scrum.org), Smartsheet Prod. Cert® 2020 Page 73 / 209 pages